Product Usage View
The Product Usage view provides a detailed, scrollable 24-month history of product usage. It consolidates data such as quantity dispensed, prescriptions filled, reorder parameters, and more, so your pharmacy can make informed decisions to better manage stock.
Accessing the Product Usage View
The Product Usage view can be opened from three different locations. Select the dropdowns to learn more.
-
Open the Drug Folder.
-
In the Inventory tab, select a pack size to view its usage data.
-
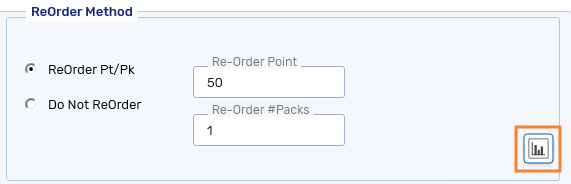
Select the Usage button
 . The Product Usage view opens.
The Usage button can only be accessed for one pack size at a time. If multiple pack sizes are selected, it will be disabled.
-
On the Order Pad, select the item whose usage data you want to view from either the Not Sent or Sent views.
-
Select the Usage action button at the bottom. The Product Usage view opens.
The Usage button can only be accessed for one item at a time. If multiple items are selected, it will be disabled.

-
Perform a search using the Cycle Count module.
-
Select a pack size to view its usage data.
-
Select the Usage action button at the bottom. The Product Usage view opens.
The Usage button can only be accessed for one item at a time. If multiple items are selected, it will be disabled.
Overview of the Product Usage View
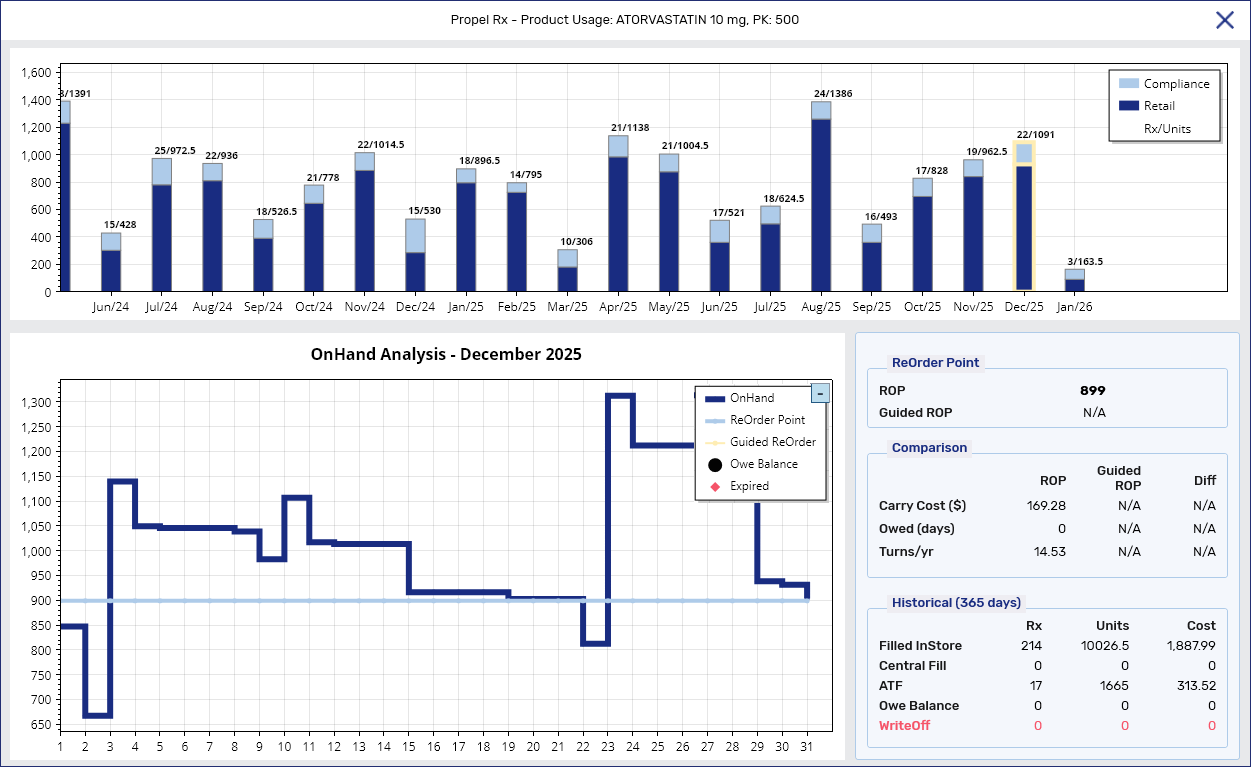
The Product Usage view is divided into three main sections: monthly usage bar graph, detailed monthly drug movement line graph, and the information panel.
Monthly Usage Graph
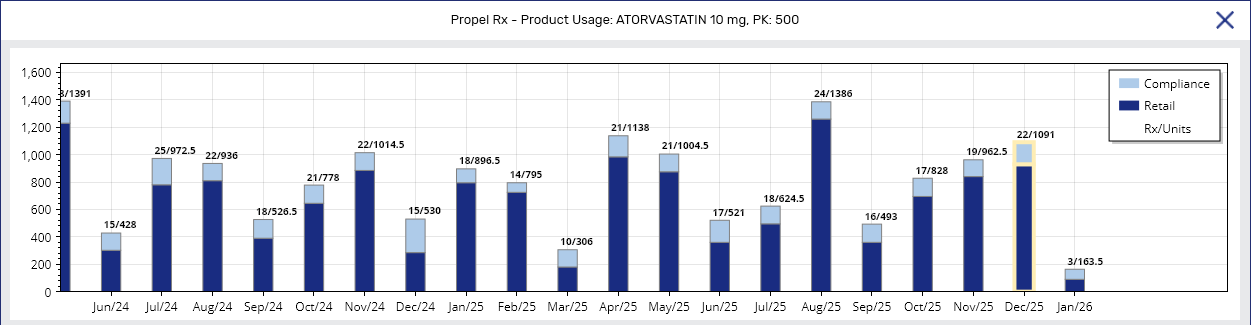
This section contains a scrollable bar chart showing 24 months of historical usage. A month is counted from 12:00am on the first day of the month till 11:59pm on the last day. The current month is anchored to the far right. Months without data show zero values.
-
Bars - each month is split into two bars for Retail and Compliance volumes. Hovering over the bar reveals a tooltip showing the number of Compliance (C) and Retail (R) units dispensed per month.
Backdated prescriptions show on their Fill Date.
-
Data labels (per bar) - at the top of each bar is a label displaying two values: (1) total number of prescriptions dispensed for that month and (2) total number of units dispensed for that month.
 Prescription exclusions
-
Prescriptions sent to Central Fill or off-site packagers
-
Prescriptions that have not completed adjudication (i.e., status is not COM or AMD)
-
-
Legend - explains the colour coding for the bar graph.
-
Scrollable navigation - use the mouse scroll to zoom in, and scroll back to zoom out.
Detailed Monthly Drug Movement
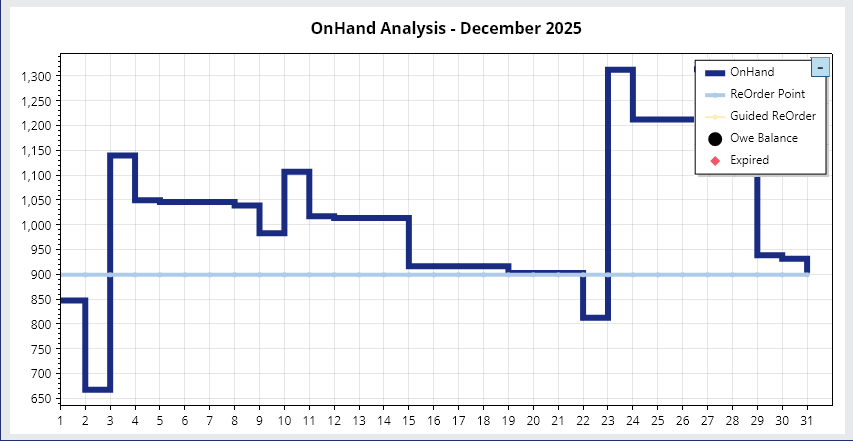
This section contains a granular line chart for the selected month (highlighted in yellow) in the monthly usage bar graph. Each column reflects movement from 11:59pm of the prior day to 11:59pm of the displayed date.
-
OnHand - the On Hand value starting from the closing inventory of the previous day. Downstrokes correspond to dispenses and negative manual adjustments. Upstrokes correspond to shipments received, positive manual adjustments, and cancelled prescriptions.
Tooltip
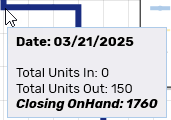
Hovering over the OnHand line for a specific day reveals a tooltip showing the:
-
Date
-
Total Units In
-
Total Units Out
-
Closing OnHand
-
-
ReOrder Point - the Reorder Point set for the pack size.
-
Guided ReOrder - the calculated Guided Reorder Point for the pack size. For more information, see Guided Reordering.
-
Owe Balance - the Owe Balance value as calculated by the formula: Current On Hand - Total Owe Amount.
Tooltip
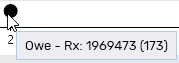
Hovering over the Owe Balance symbol
 reveals a tooltip showing the prescription number and owe quantity in brackets.
 -
Expired -manual adjustments made with the reasons: "Expired product destroyed and written off" or "Expired product sent to Medturn/Inmar/Mckesson."
Any custom expiry codes entered in List Maintenance > Adjustment Reason Code will not be counted. To avoid using them in error, add "zzz" to the front of their name in List Maintenance so they drop to the bottom of the list.
Tooltip
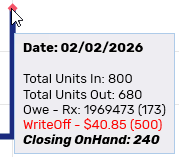
Hovering over the Expired symbol
 reveals a tooltip showing the:
-
Date
-
Total Units In
-
Total Units Out
-
Owe - Rx # (owe quantity)
-
WriteOff - calculated by the formula: total units x unit cost (quantity)
-
Closing OnHand
-
-
Legend - explains the colour coding for the lines. You can collapse this legend by selecting the "-" icon in the top right corner.
Information Panel
This section is divided into three sub-sections displaying the reorder parameters, comparison data when using the Reorder Point versus the Guided Reorder Point, and historical data over the past 365 days.
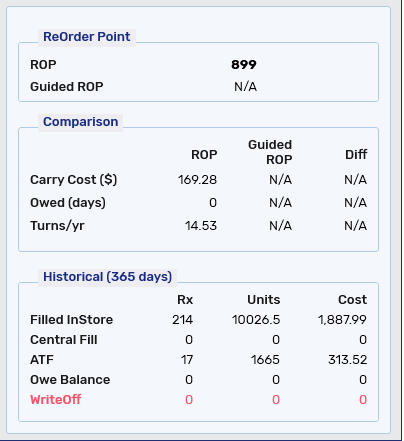
The Reorder (Pt) and Reorder (Pk) is the manually set Reorder Point and Reorder # of Packs for the selected pack size, whereas the Guided ROP is the calculated Guided Reorder Point. These are the same values that display in the Drug Folder Inventory tab for the pack size.
The Comparison sub-section allows you to view key inventory metrics so you can make an informed decision about whether to use the manually set Reorder Point or calculated Guided Reorder Point. Review Table 1 for information on how the values are derived.
Table 1. Overview of the Comparison sub-section in the Product Usage view.
| Field | ROP | Guided ROP | Diff |
|---|---|---|---|
| Carry Cost ($) | Re-Order Point x Unit Cost | Guided Re-Order Point x Unit Cost | Carry Cost with Guided ROP - Carry Cost with ROP |
| Owed (days) | Number of days where dispense volume exceeded the Re-Order Point | Number of days where dispense volume exceeded the Guided ROP | Owed (days) with Guided ROP - Owed (days) with ROP |
| Turns/yr | Cost of Goods Sold* ÷ Average Inventory Value** | (Number of Units Dispensed ÷ Average Monthly On Hand Quantity) x (ROP ÷ Guided ROP) | Turns/yr with Guided ROP - Turns/yr with ROP |
*Cost of Goods Sold = Total Units Dispensed x Current Unit Cost
**Average Inventory Value = [(On Hand from 12 Months Ago x Unit Cost) + (On Hand from the Current Date x Unit Cost)] ÷ 2
The Historical sub-section includes data from the past 365 days.
Table 2. Overview of the Historical sub-section in the Product Usage view.
| Field | Rx | Units | Cost |
|---|---|---|---|
| Filled InStore | Total number of prescriptions filled for the pack size (excluding Central Fill* and off-site packager prescriptions) | Total number of units dispensed (excluding Central Fill* and off-site packager prescriptions) | Total Units x Unit Price |
| Central Fill | Total number of prescriptions sent to an off-site packager or Central Fill* | Total number of units dispensed by Central Fill* or off-site packagers | Total Units x Unit Price |
| ATF | Total number of prescriptions enrolled in Auto Refill | Total number of units dispensed for Auto Refill prescriptions | Total Units x Unit Price |
| Owe Balance | Total number of Owe Balances | Total number of units that were owed | Total Units x Unit Price |
| WriteOff | Total number of manual adjustments that were expiries** | Total number of units manually adjusted due to expiry** | Total Units x Unit Price |
*Prescriptions flagged as Central Fill Print Only will be counted as Filled InStore.
**Manual adjustment reason was "Expired product destroyed and written off" or "Expired product sent to Medturn/Inmar/McKesson."